Learn Python by Building Data Science Applications
A project-based Python intro that grew out of a course my brother and I taught — and the high school where we both graduated.
View the book → · code on GitHub →
 Learn Python by Building Data Science Applications. Packt, 2018 · co-authored with David Katz.
Co-authored with David Katz. The book grew out of a Python and data course we taught together at Liceum 33 in Kazan around 2017 — and became a Packt title in 2018.
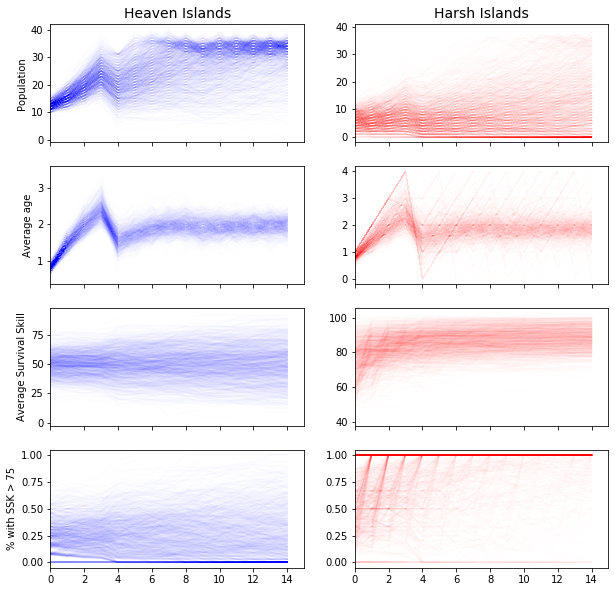 Simulating Animal Population with Monte Carlo. From the modeling chapters — many draws, one question.
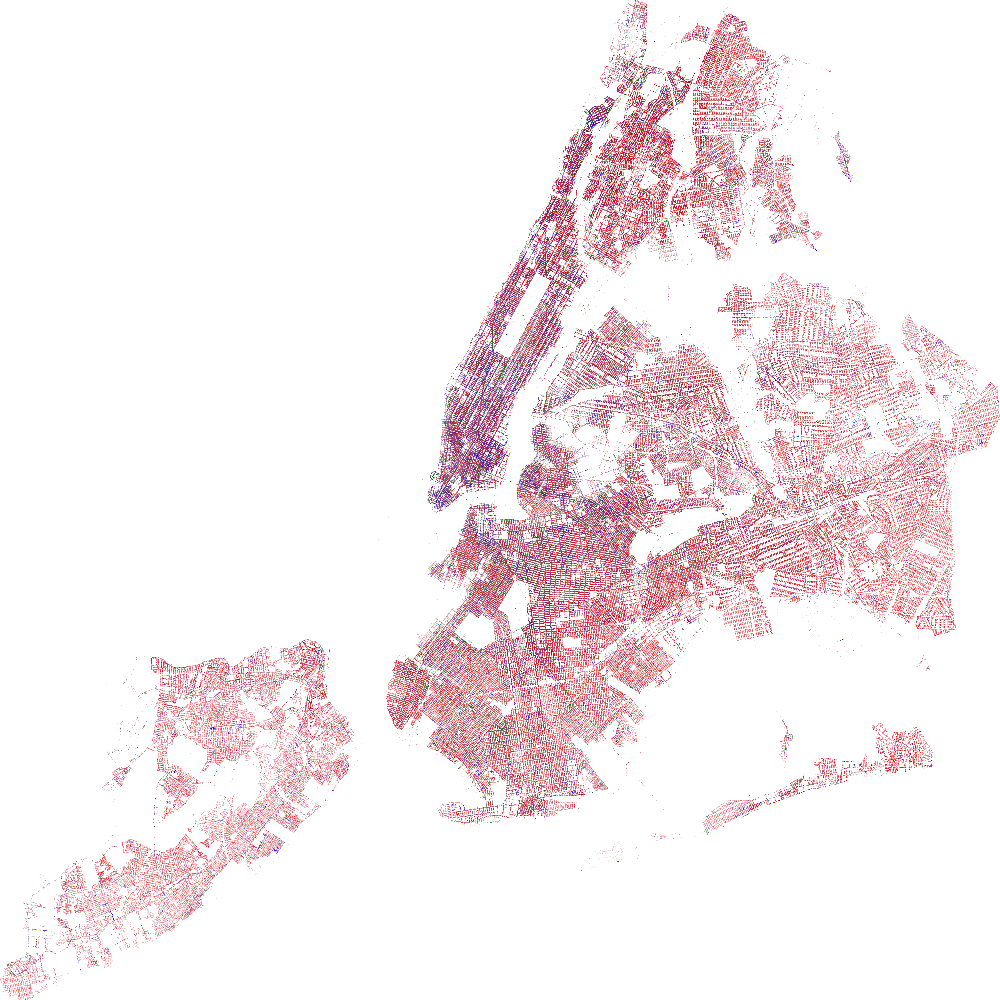 Years of 311 calls in NYC, by source. Visualizing big data on the map — a separate skill and a specialized set of tools.
It walks through Python basics, NumPy and Pandas, then several real projects — not a single storyline. There is simulation: Monte Carlo models of animal populations. There is working with large datasets: years of NYC 311 service requests, aggregated and mapped at a scale that needs its own tools. And there is a full collect → clean → visualize arc: scraping WWII battle pages from Wikipedia with Beautiful Soup, structuring the mess, and carrying it through analysis and charts. WWII was the showcase for that last skill set — relatable, rich enough to scrape, meant to combine data with meaning — not the only subject in the book.
We picked WWII for that collecting-and-cleaning thread for the reasons above. Once you analyze it with any depth, though, the story turns dark — casualties, geography of destruction, hierarchies of campaigns. I wouldn't choose that subject for high school students again, and by extension I wouldn't anchor a beginner book on it today. The code patterns still hold; the framing was a bet I'd make differently now, especially given developments of the recent years.