Structure of 311 service requests as a signature of urban location
The mix of problems a neighborhood reports to 311 turns out to be a reliable signature of the place itself.
Lingjing Wang, Cheng Qian, Philipp Kats, Constantine Kontokosta, Stanislav Sobolevsky · PLOS ONE 12(10): e0186314, 2017 · Read the paper →
This was a project from Stanislav Sobolevsky's group at CUSP. It was the first piece of science I'd written in English. My work was mostly focused on the clustering. The idea is quite simple and elegant. Planning, policy, and real estate all depend on knowing the character of a particular neighborhood, and that kind of local detail is usually expensive to gather, slow to arrive, or simply missing. A census describes a place in fine detail, but only once a decade. So, to track those changes in near-real time and for free, we turn to the city's own open data — the records of 311 complaints.
In the US, 311 is a service not unlike the famous 911, minus the emergency: if you have noise, illegal parking, a leaking water fountain, or a pothole, you call 311. I've used it myself a few times, to report idling cars. The phone number is standardized, but the data isn't — its structure differs a little from city to city. New York alone logs more than a million of these calls a year, and each one is tagged with what the problem was and where it happened. There the data is updated daily and published through an open data portal. Every complaint comes with a category, so our idea was simple: build a signature for each neighborhood from the normalized proportions of the complaints it files. That signature is "the unique way people use 311," as we put it in the paper.
With those signatures in hand, could we spot similar neighborhoods, and even — maybe — "nowcast" changes in a city without waiting for the next census? That's the question the paper set out to answer.
A signature made of complaints
In practice it's about as simple as it sounds. The Census Bureau already carves a city into roughly two thousand small areas — census tracts, each about the size of a neighborhood. For every tract we took its 311 calls, counted them by type, and turned the counts into proportions: what share was noise, what share was heat, and so on. That list of proportions, adding up to one, is the neighborhood's signature. Then we let a clustering algorithm do the obvious thing — pull together the tracts whose signatures look alike. No map, no demographics, nothing but the complaint mix went in. In New York, four clear groups fell out.
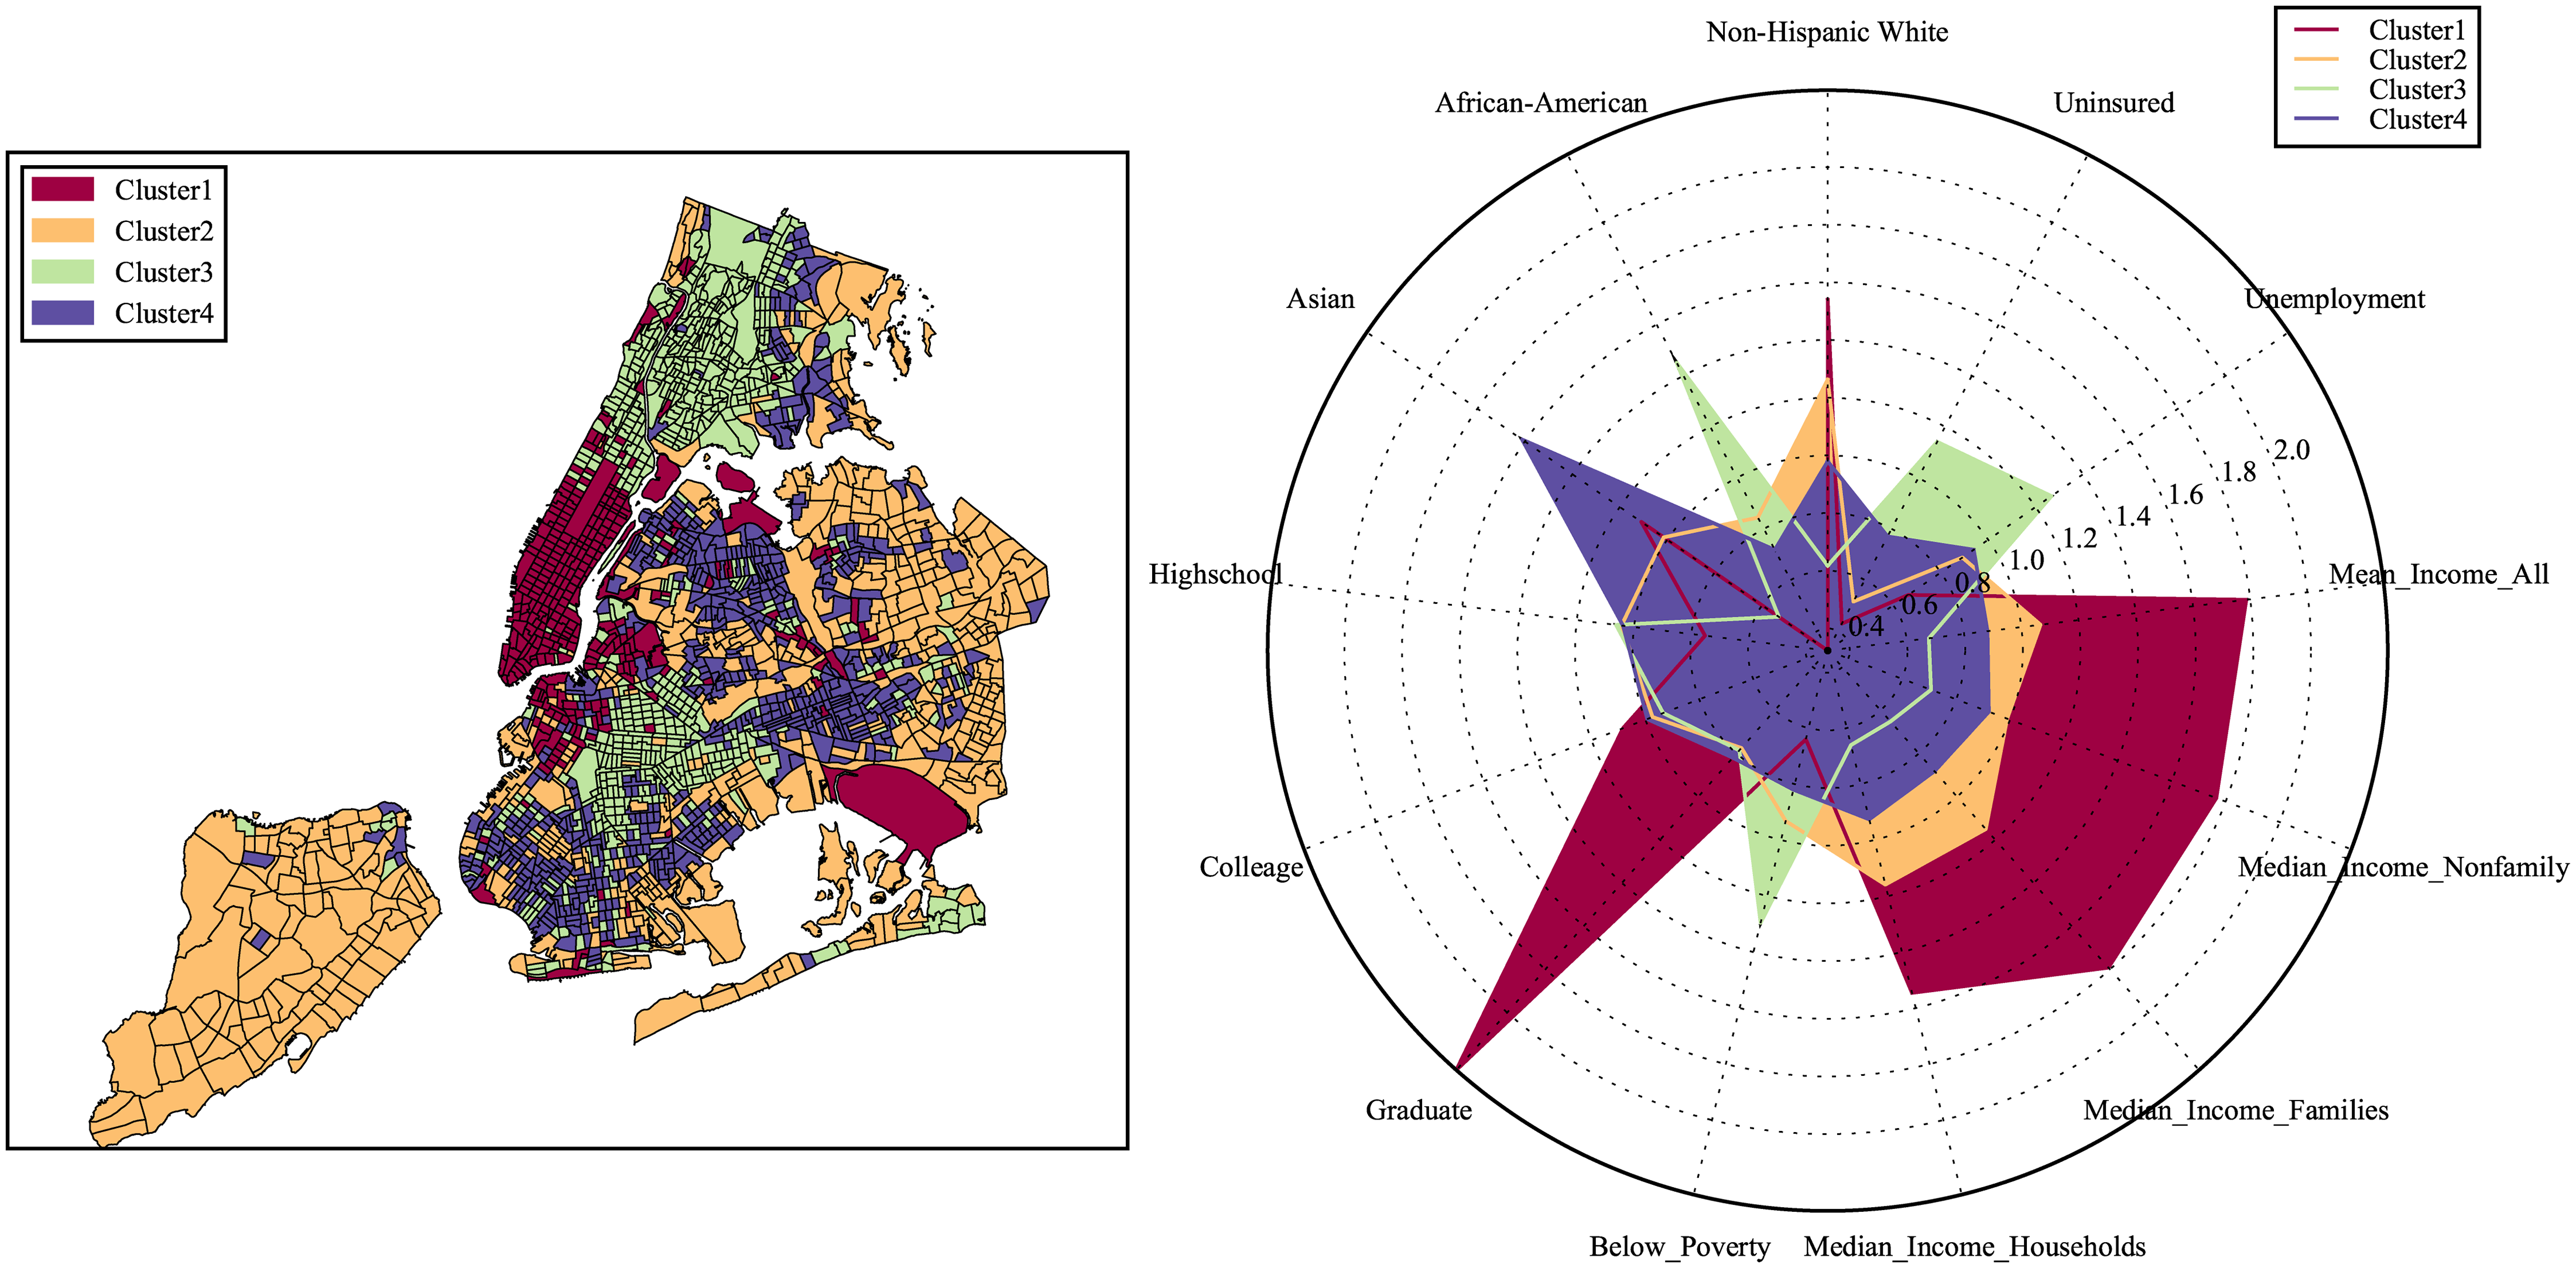
The groups were easy to recognize on a map. One was the loud, dense core of the city — Midtown, downtown Brooklyn, and, a little oddly, the airports — where most calls were about noise. A quieter, more residential stretch of Brooklyn and Queens stood out for blocked driveways. Another group was defined by heating complaints, and another by the state of the streets.
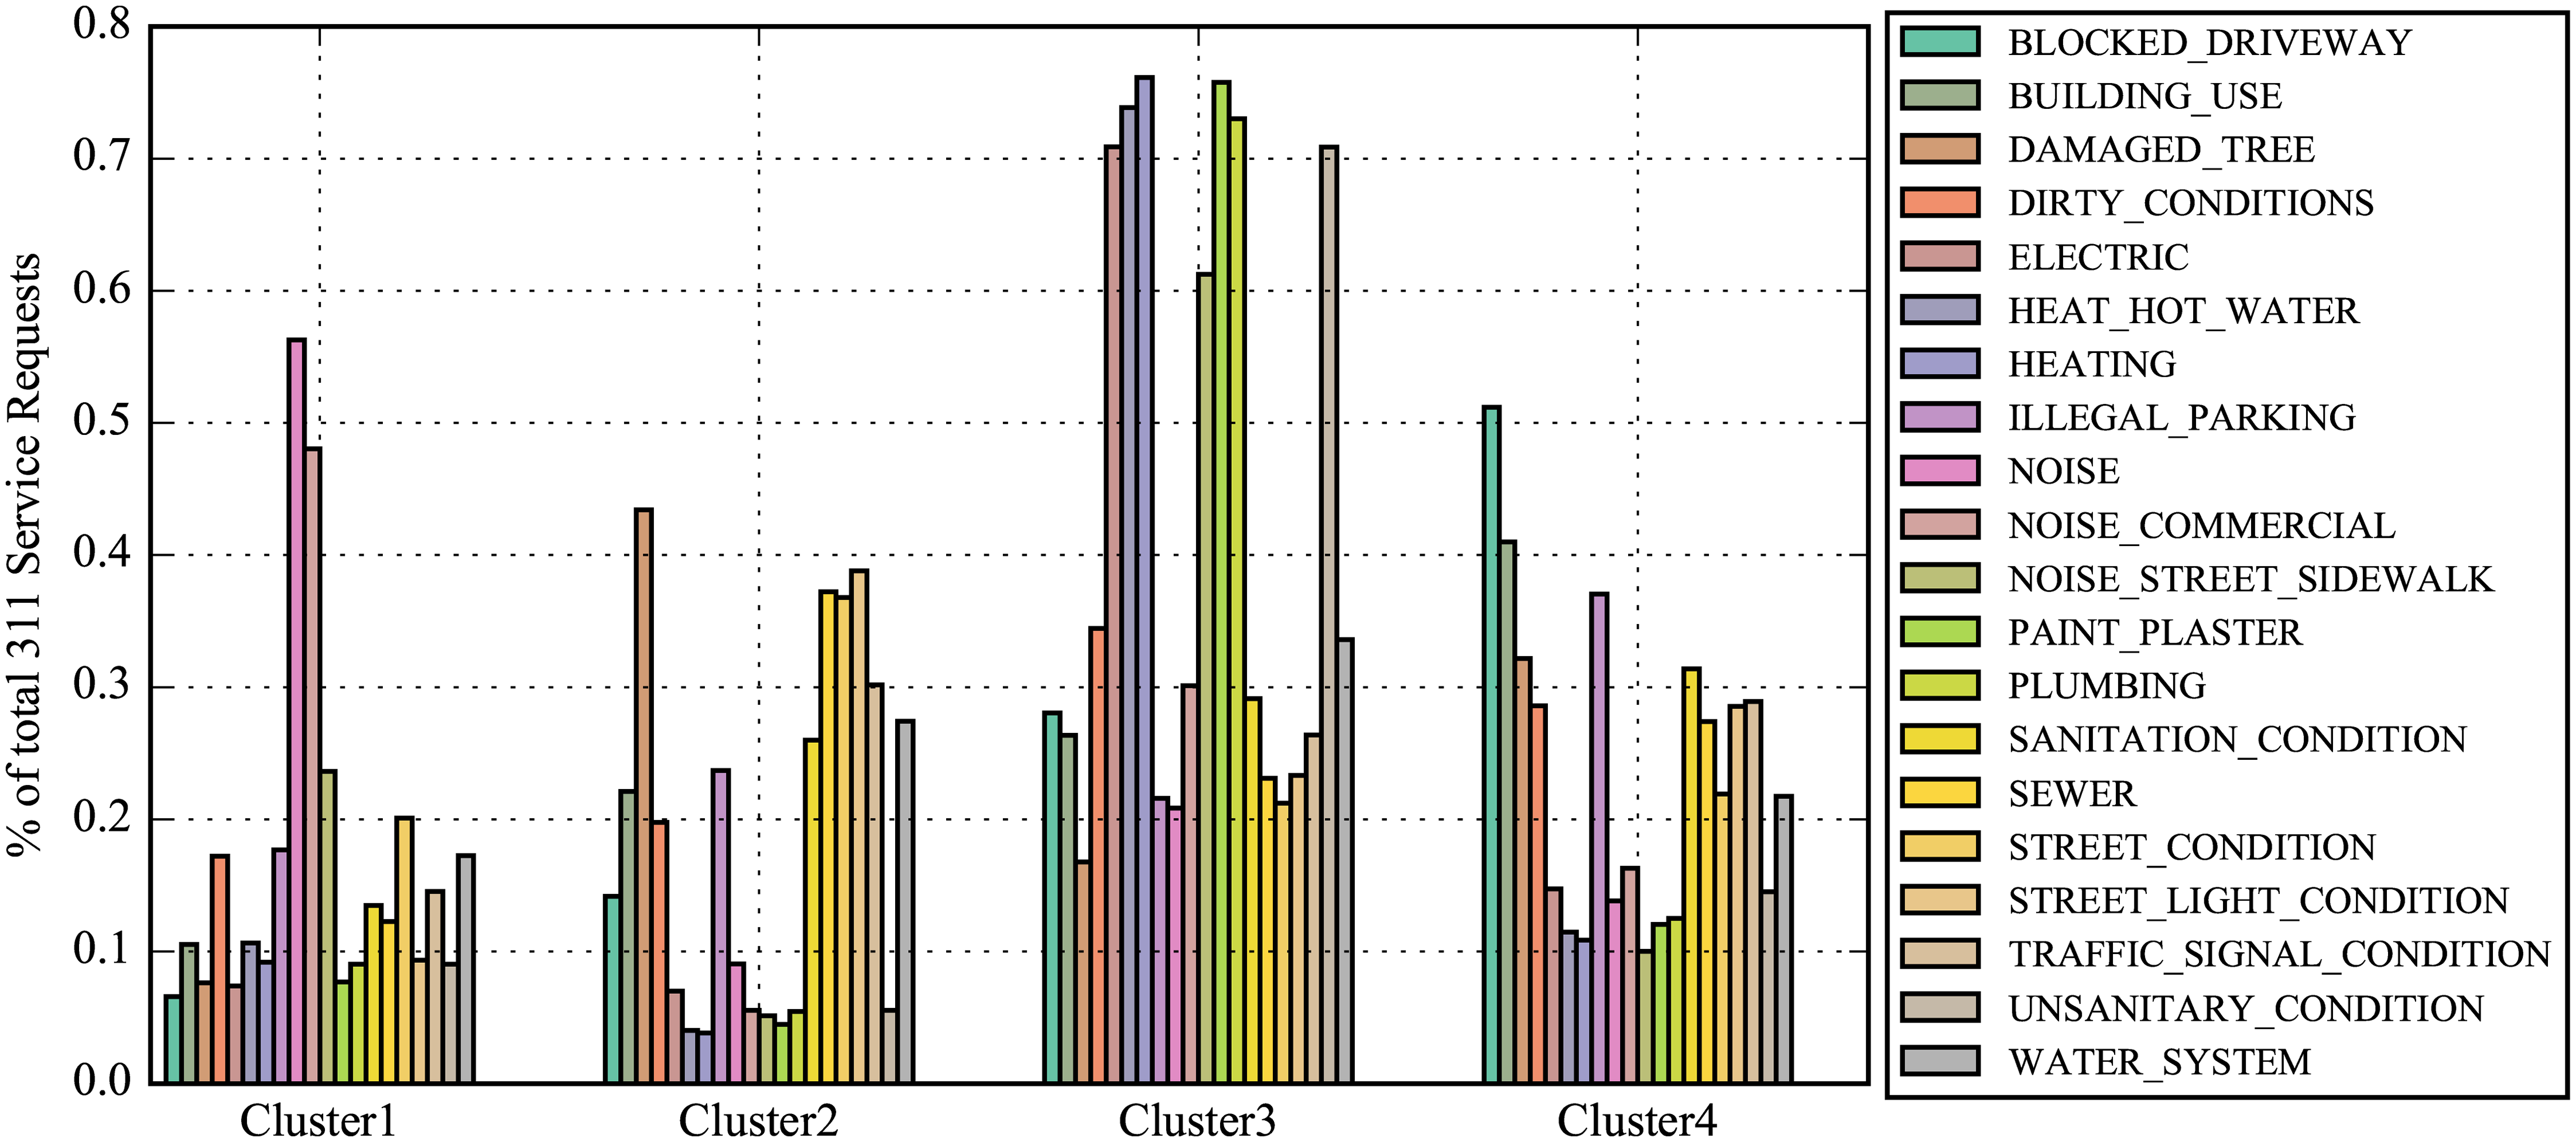 What sets them apart. The share of each request type within the four clusters — noise, heating, blocked driveways, and street conditions each dominate a different group. Fig 2.
Checking against the census
Here's the part I find satisfying. We built those groups from complaints alone — not a single figure about income, education, or race ever went in. So the honest test was to bring in the census (the 2014 American Community Survey) and ask whether the groups lined up with anything real. They did, and cleanly: income, schooling, unemployment, health-insurance coverage, and racial makeup all separated between groups the algorithm had drawn while blind to every one of them. That comparison is the radar plot above.
From there it was a short step to actually predicting things. We trained a few standard models to read a neighborhood's socioeconomic profile — and even which way its real-estate prices were heading — from the 311 signature alone. (For the prices we used Zillow's data, years before I'd end up working there.) And none of this was a New York quirk: run the same recipe on Boston and Chicago, and the same kind of structure comes back.
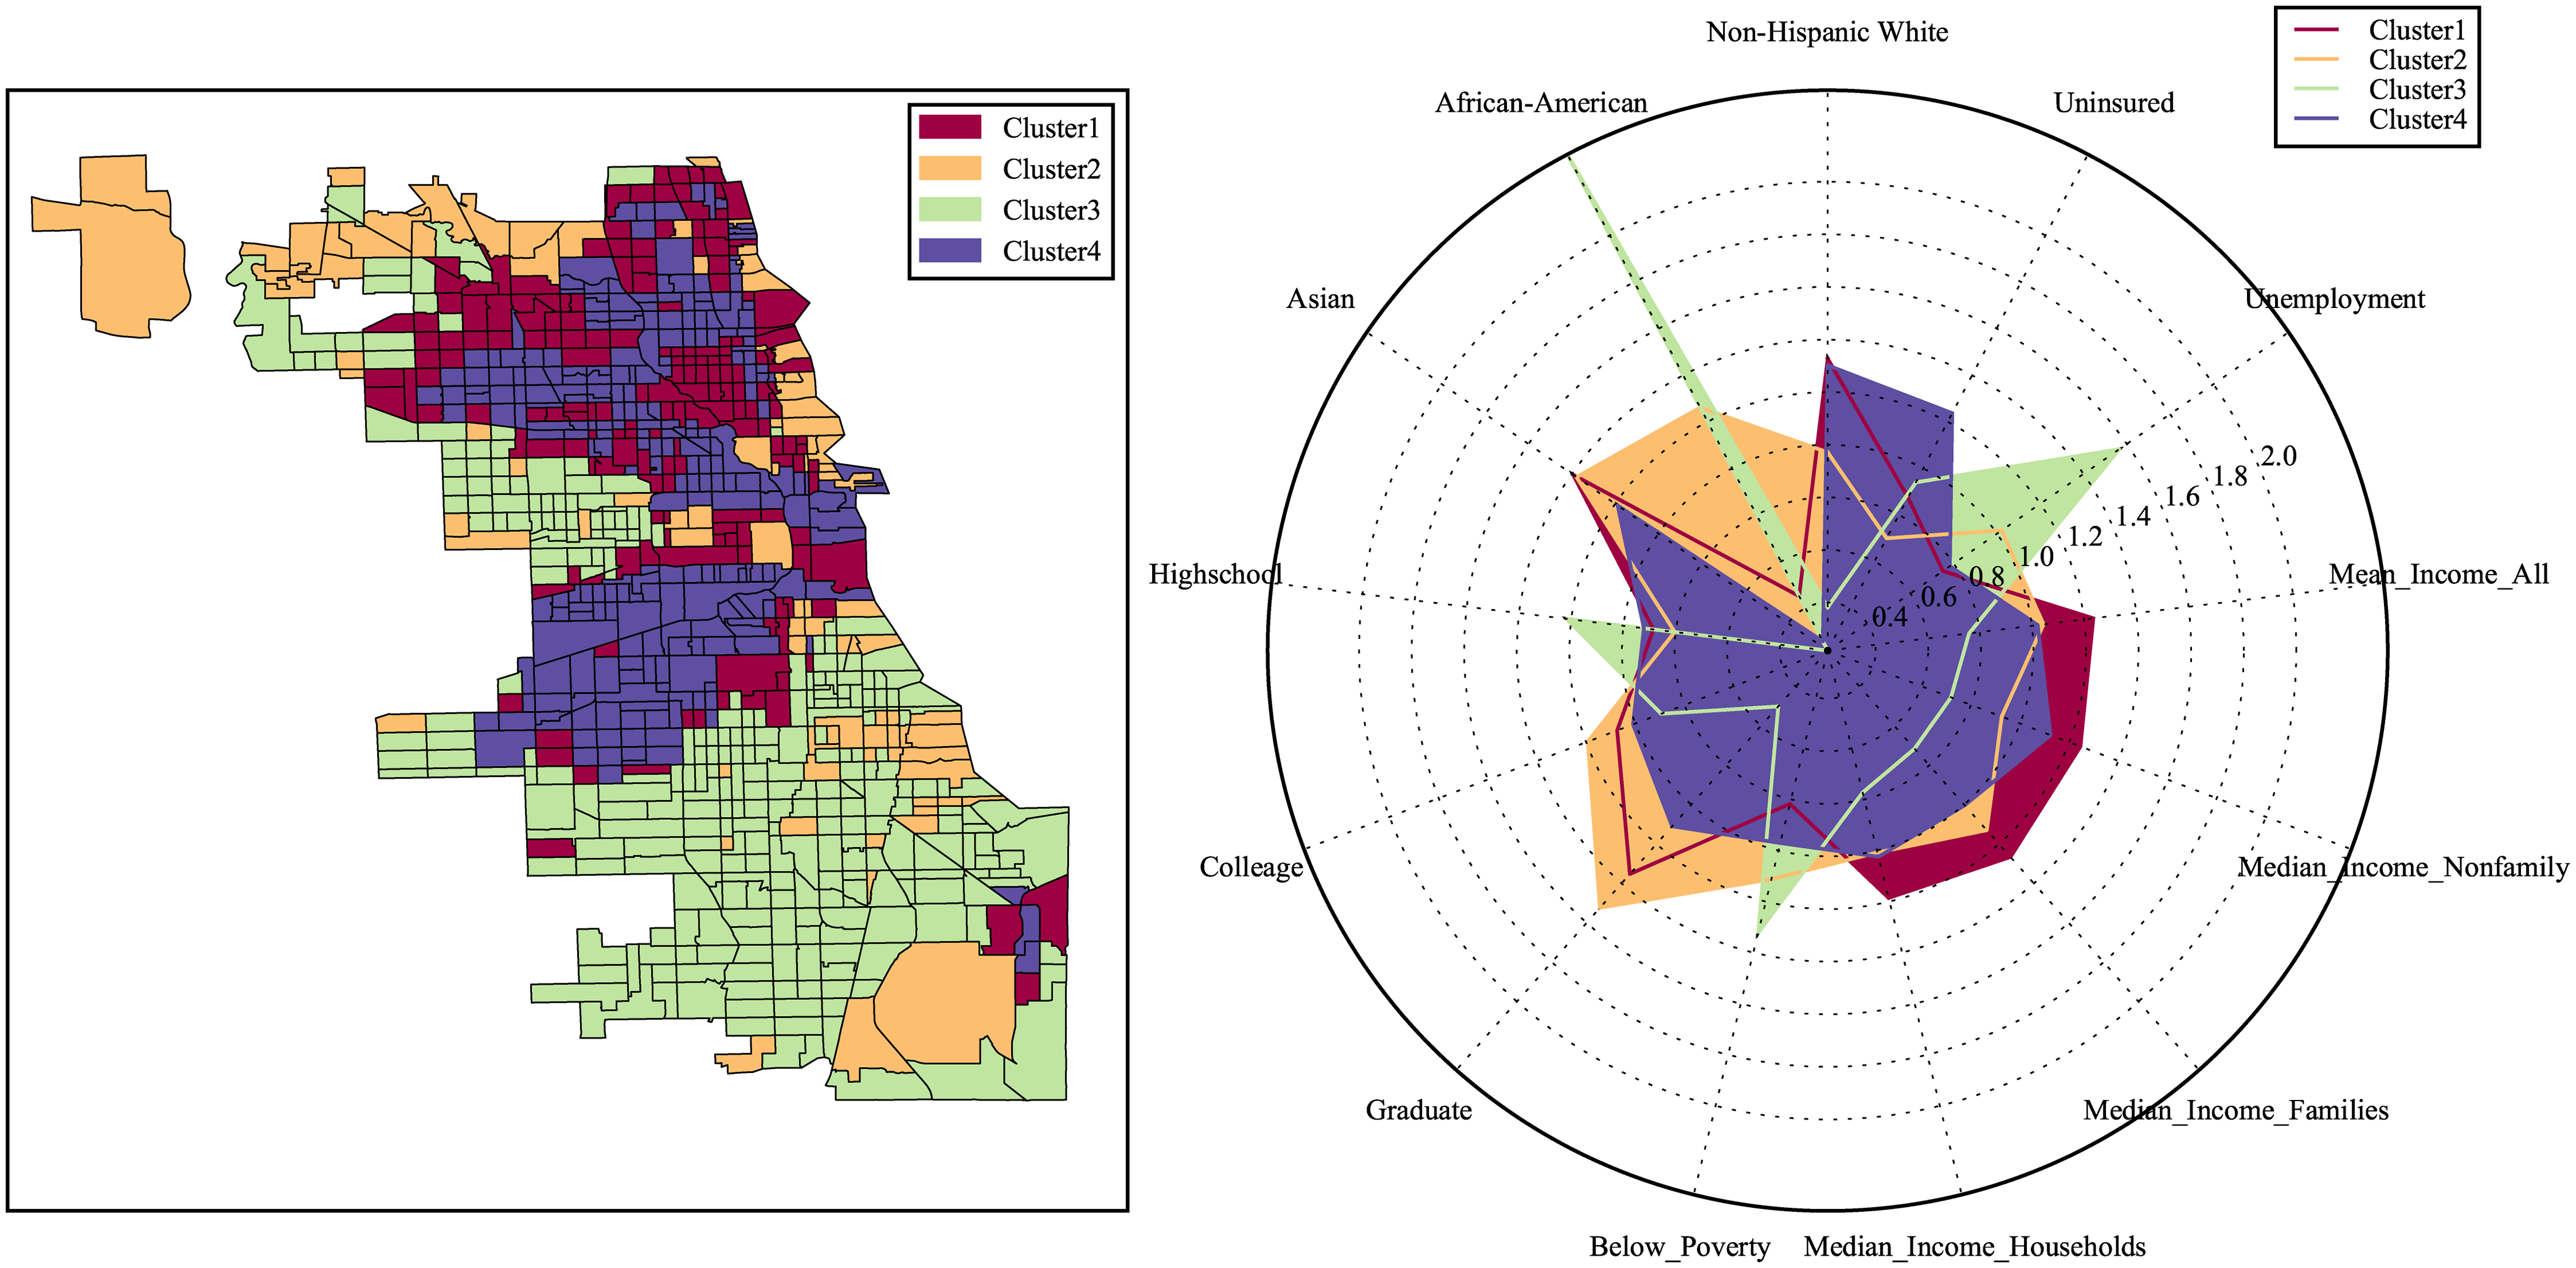 Not only New York. Chicago, the same method: four clusters (left) with their own distinct socioeconomic profiles (right). Boston behaved much the same. Figs 3 & 6.
What I took from it
What I like most about this work is how little it needed. No new sensors, no survey budget — just the ordinary data a city already keeps, read back as a portrait of itself. That a place's everyday data can be a cheap, honest lens on it is the throughline that runs from my data-journalism years into CUSP. The writing, for me, was the hard part — slower and more painful than the analysis, and, looking back, some of the most useful work I've done.
The limits are the part I keep coming back to — most of them are still open questions for me. A 311 signature only records who calls about what, so it carries the bias of who picks up the phone in the first place. Which neighborhoods stay quiet not because nothing's wrong, but because no one there trusts the line? Prices lag too — a recorded sale reflects a decision taken months earlier — so how early can a signature really catch a place beginning to turn? None of this sinks the idea; it just marks where to tread carefully. The promise was never that complaints replace the census, only that a city, watched closely, will tell you where it's changing — often early enough to do something about it.
My one real regret is cosmetic — the figures. Those colors are loud and dated, and I'd love to recolor every one of them. The idea deserved cleaner pictures than it got.