Agate: an Obsidian plugin that turns Bases into data visualizations with Vega
What it is
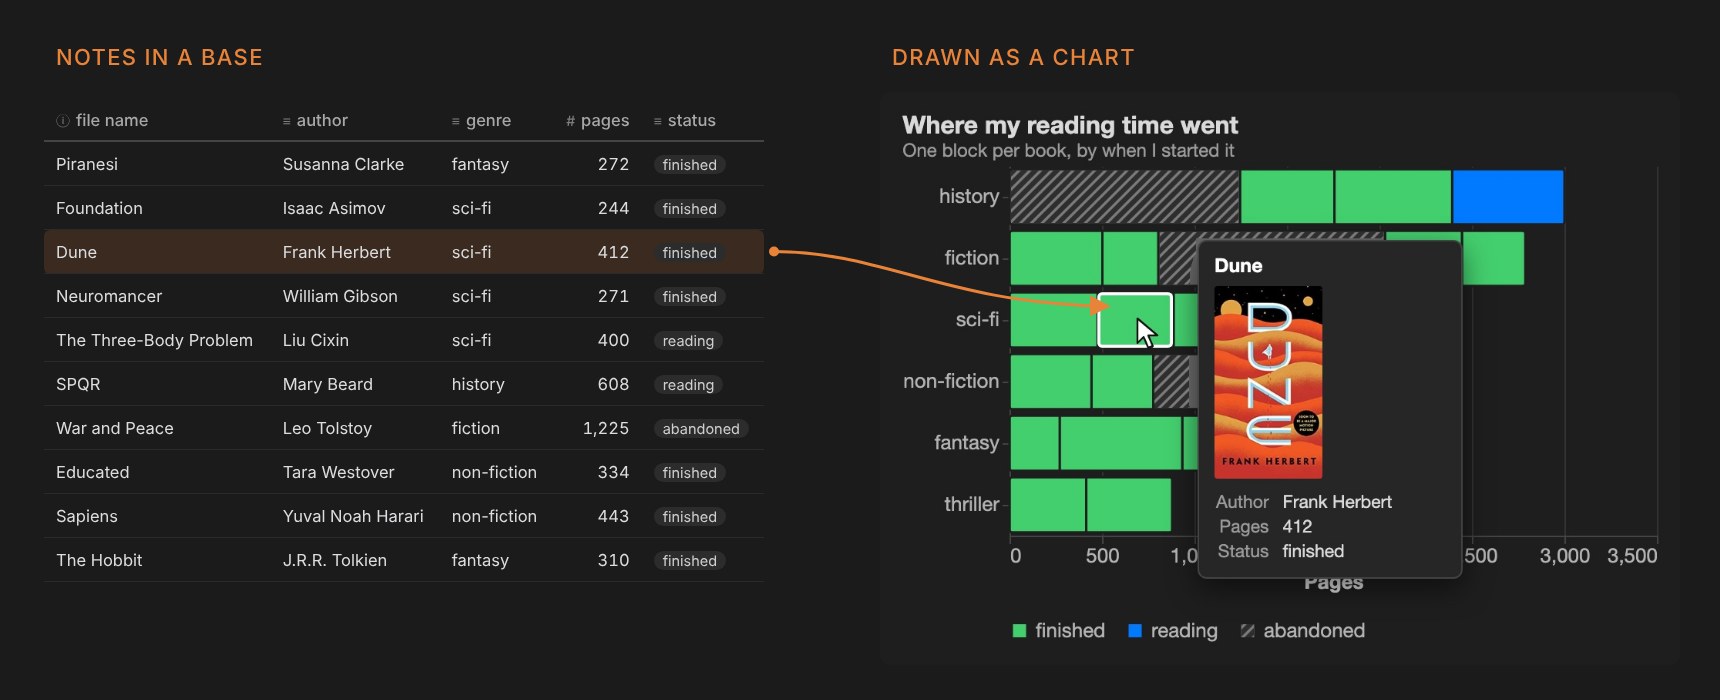
Agate is a plugin for Obsidian that draws charts from your notes. It adds an Agate chart view to Bases: the base picks the notes, a Vega or Vega-Lite spec describes the picture, and the chart redraws when the notes or the base's filters change.
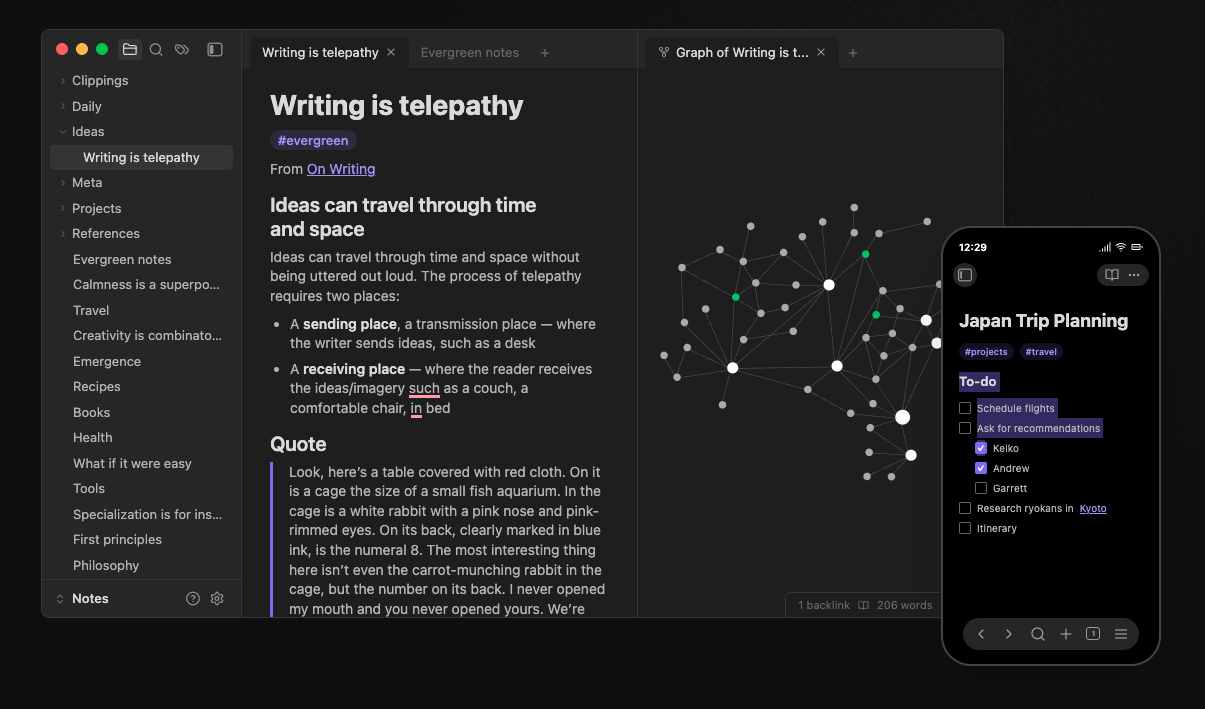 Obsidian. Notes, folders and the links between them, on desktop and mobile. obsidian.md
Obsidian is a note-taking app that keeps notes as plain Markdown files in a local folder, called a vault. Notes can carry properties — a date, a rating, a place, a link to another note. Bases, a core Obsidian feature, queries notes by those properties and shows them as a table you can filter, sort and group, much like a small database.
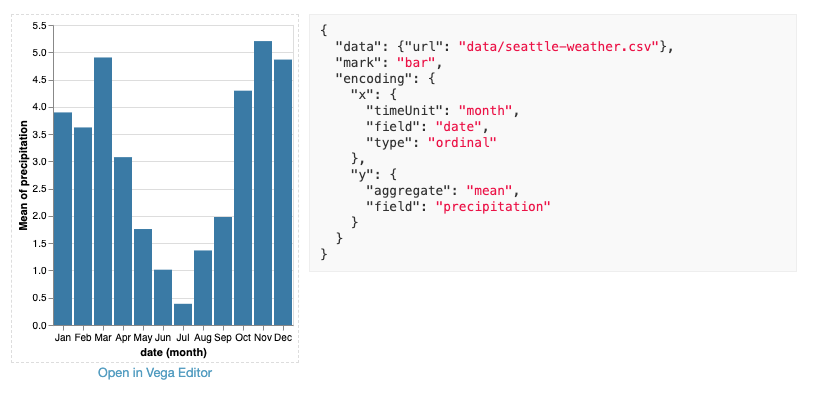 Vega-Lite. Twelve lines of JSON — data, mark, encoding — and the chart they draw. Vega-Lite examples
Vega and Vega-Lite are languages for describing a chart as JSON, developed at the University of Washington's Interactive Data Lab. A spec says where the rows come from, which marks to draw, and which fields map to position, color and size; the library renders it. Vega-Lite is the short form for most charts, Vega the full language underneath.
Install and links
In Obsidian: Settings → Community plugins → Browse, search Agate. Needs Obsidian 1.13+ with the core Bases plugin enabled; works on desktop and mobile.
Website · Quickstart · Gallery · GitHub
What to use it for
To me, Obsidian's main value is its simplicity and flexibility: there is no declared structure or format for your notes. As a result, finding a structure that works is the user's own quest — a hard one, and never a one-time thing. That's why I wanted Vega here: freedom in how I visualize my notes, combined with charts I can reuse and that stay live as the notes and their structure change.
Vega Visualizations already renders Vega in Obsidian, but with the data written into the spec. Agate connects it to Bases, and I now use it daily.
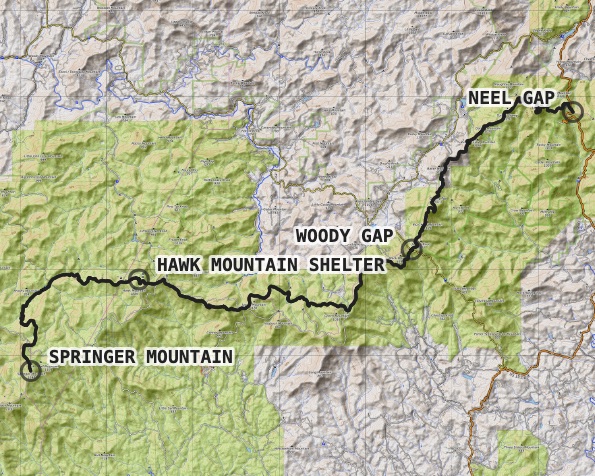 Outdoors. A three-day section of the Appalachian Trail over terrain tiles, camps and peaks labeled.
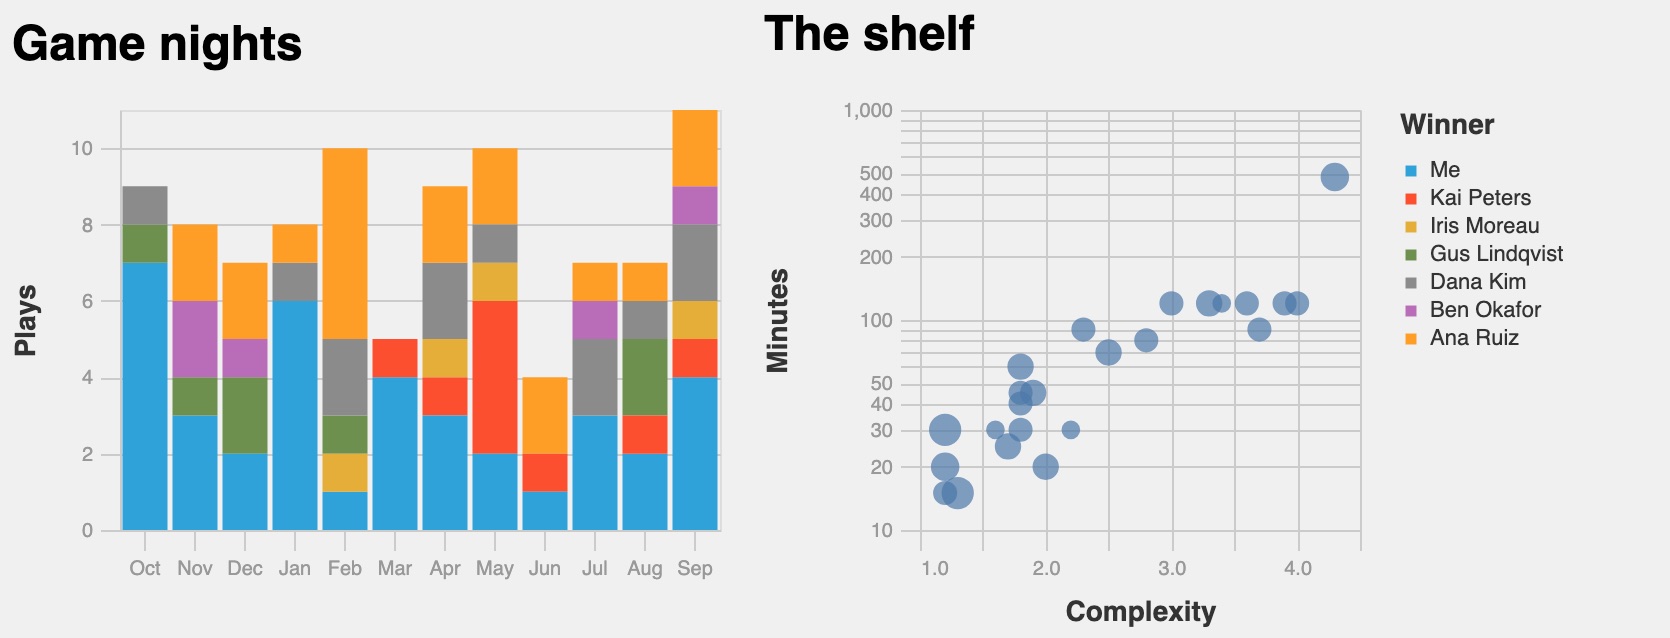 Collections. Game nights by winner, and the shelf by length and complexity — one note per game and per play.
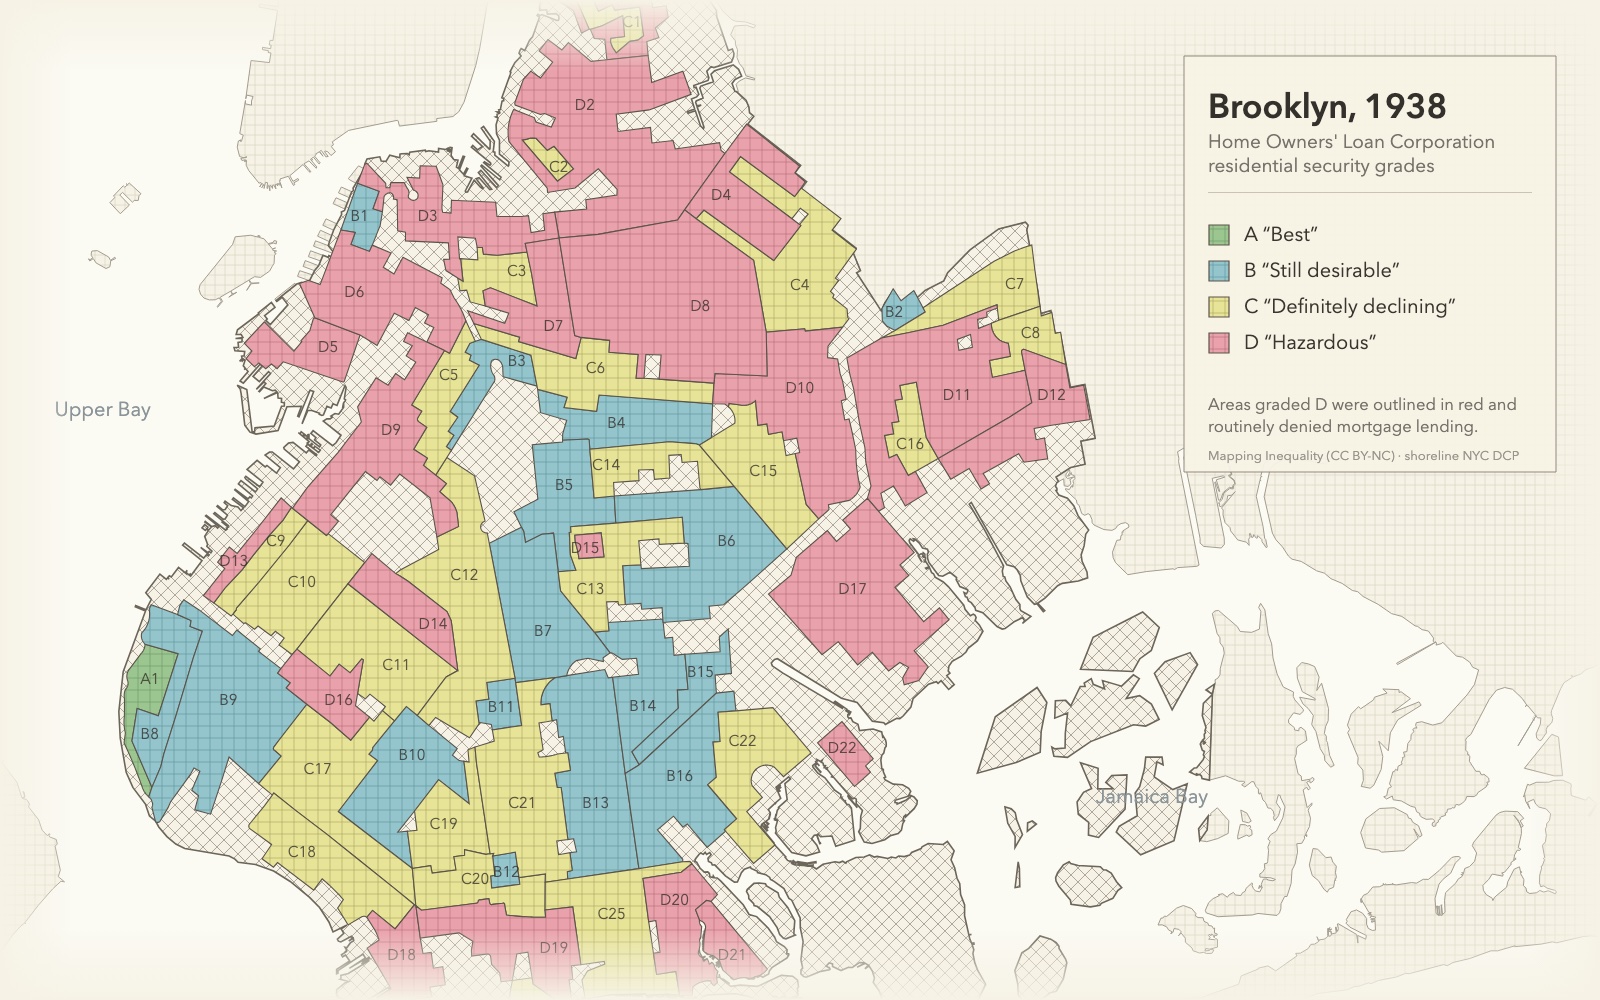 History. Brooklyn's 1938 HOLC redlining map, drawn from a GeoJSON file with hatched fills.
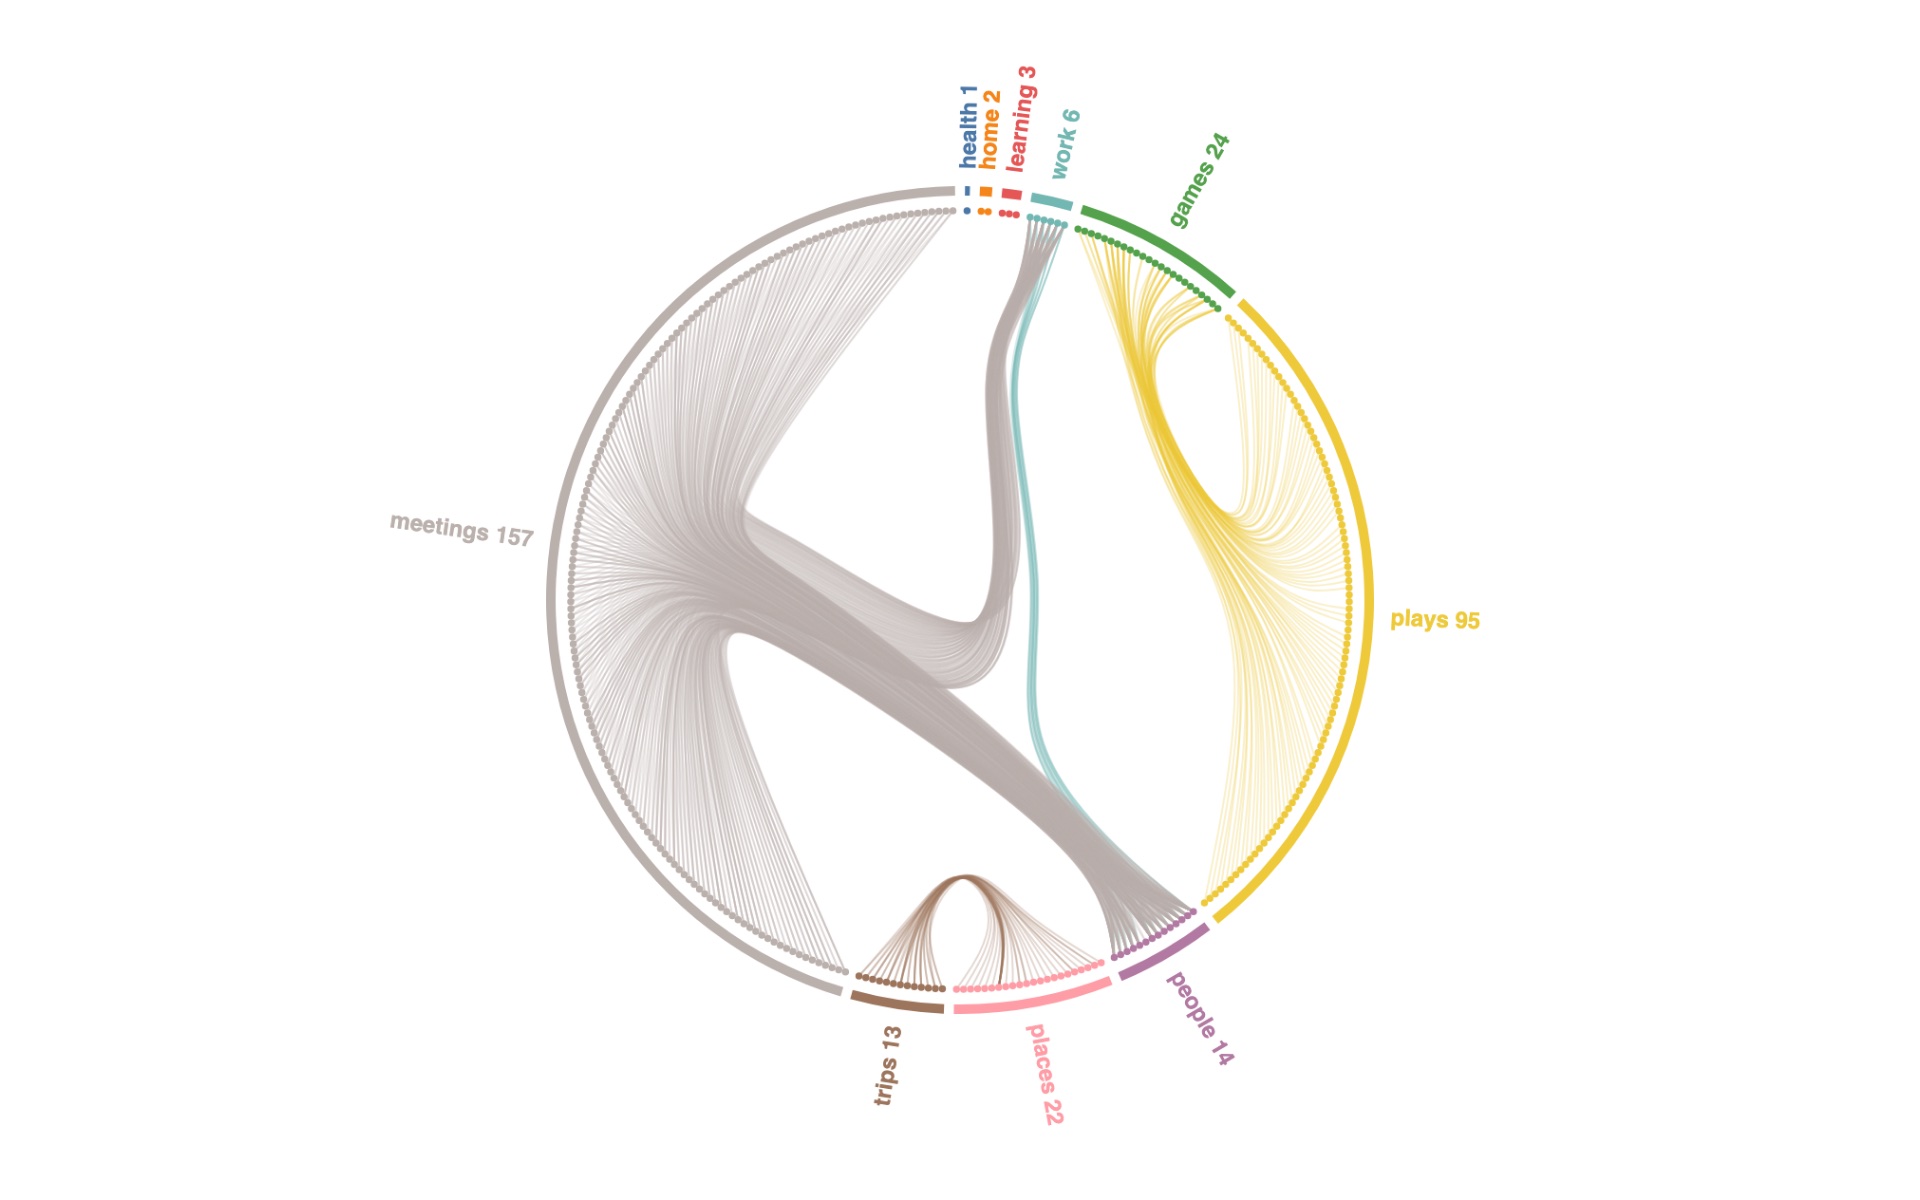 The vault itself. Links between notes, grouped by folder.
- Learning and practice. I keep a note per interview problem, with scores before and after reading up; the chart shows which topics improve and which I keep avoiding.
- Travel. Place notes with coordinates, linked from trip notes, become routes on a globe — mine shows our Azores trip.
- Work. I track my goals and OKRs, as well as Jira tickets synced into the vault, thanks to two plugins: Jira Issue and Jira Weaver.
- Headline numbers. Big numbers were almost an afterthought; they became the feature I use most.
- Collections — board games, books, records: what gets played or read, and what doesn't.
- Habits and mood — a few numbers in a daily note, accumulated into a year; Habit Tracker 21 handles the daily check-ins.
- The outdoors — runs and hikes, with a multi-day route over a basemap.
- Campaigns and worlds — D&D sessions, characters and factions as linked notes.
- History — events with dates and places, or historical maps like Brooklyn's 1938 redlining.
- The vault itself — how notes link, and which folders take up space.
How to start
The quickstart walks through a first chart in about fifteen minutes, with a starter set of 26 book notes. In short:
- Give your notes consistent properties in the frontmatter —
genre,pages,status— with numbers as numbers and dates asYYYY-MM-DD. - Create a base that picks those notes, e.g. every note with
type == "book". - Add a chart: in the base, add a view with the Agate chart layout, then pick one of thirteen recipes, ask an assistant (see below), or write a spec by hand. A spec can also live in any note, inside an
```agatecode block:
base: Reading/Books.base
spec:
  # Books per genre, colored by status. Edit a note and this redraws.
  mark: {type: bar, tooltip: true}
  encoding:
    y: {field: note.genre, type: nominal, sort: "-x"}
    x: {aggregate: count, title: Books}
    color: {field: note.status}
Fields are the property ids you see in the base (note.genre, file.name); the rest is plain Vega-Lite. The chart appears wherever a base does — its own tab, embedded in a note (![[Books.base#Ratings]]), the sidebar, a Canvas — and clicking a mark opens the note behind it.
The spec is a plain JSON or YAML file next to the notes: it syncs and versions like any other file, and still runs in the Vega editor outside Obsidian. Agate makes no network requests by default; remote data and map tiles load only once you allow them.
Charting in the age of AI
Vega and Vega-Lite have been around for over a decade, with plenty of public specs and examples, so language models already know them well: describe a chart in plain words and any capable assistant writes a working spec. That shaped a deliberate choice — Agate has no chart-builder wizard with panels of options. Most people would ask an LLM anyway, so Agate helps the assistant instead:
- Dynamic prompt. Copy prompt for an LLM writes a prompt for the current base: its properties and their types, a few sample rows, and Agate's conventions. Paste it into any chat, add what you want, and Paste spec checks the reply and saves it as the view's chart (guide).
- Theme prompt. Copy theme prompt does the same for styling: it reads your current Obsidian theme, so an assistant can write a matching chart theme (themes).
- Skill. For agents that work on the vault directly (Claude Code and similar), the
agate-chartskill teaches Agate's conventions and has the agent render a spec before handing it over.
Extras on top of Vega
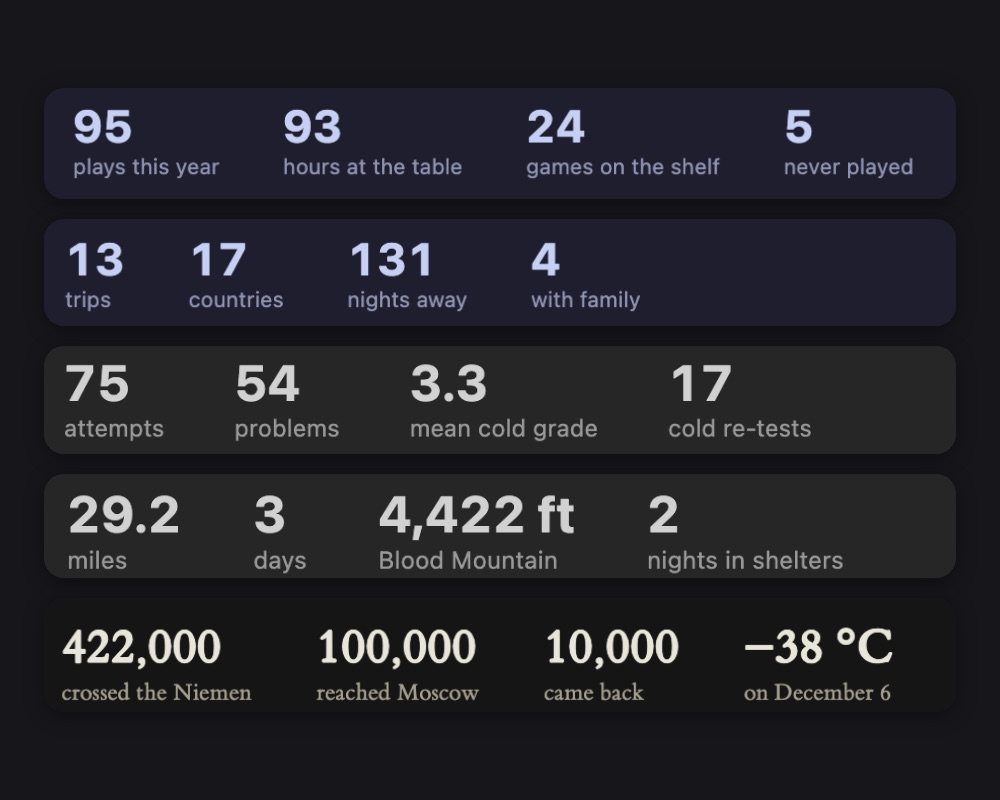 Big numbers. Live totals and averages as note text rather than a chart. They follow the base's filters like any view.
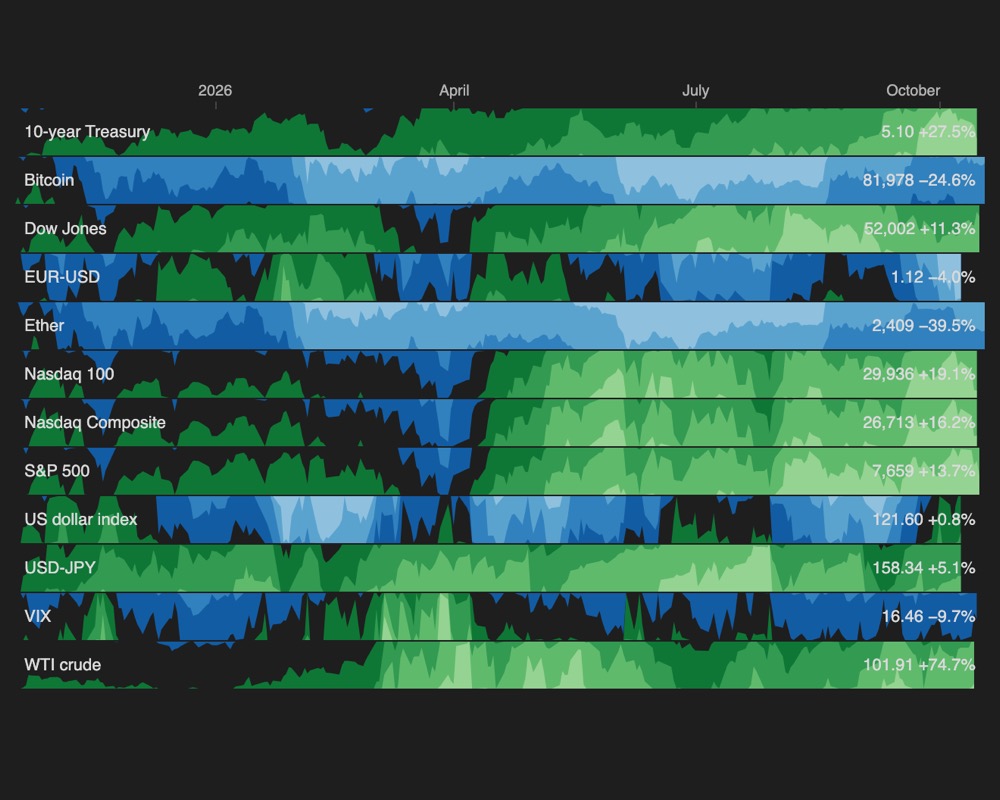 Per-note data. One row per note, each drawing its own time series as a cubism-style horizon chart.
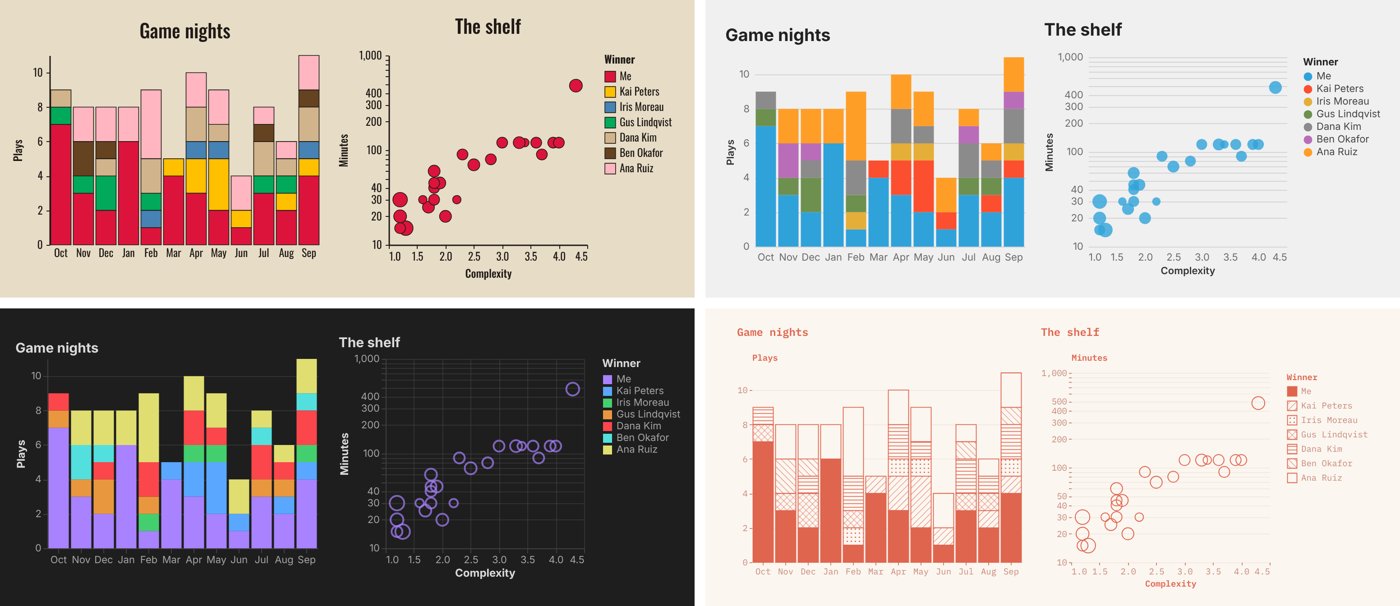 Themes. One spec, four looks. The theme lives apart from the spec and can follow your Obsidian theme, light or dark, as it changes.
Plain Vega covers almost any picture, but a vault is not a CSV file: notes link to each other, sit in folders, and often stand for something measured elsewhere. A few extras make that available to a spec, without leaving the standard grammar — Agate's additions live under usermeta, which Vega ignores, so specs stay portable.
- Big numbers — headline figures (books this year, average rating, change from last year) shown as text.
- The vault as data — links between notes and the folder tree are available as datasets, for link graphs, arc diagrams and sunbursts.
- Per-note data — a note can point to its own CSV, JSON or URL, e.g. a price history per stock note.
- Basemaps — map tiles under routes and points, with API keys kept in Obsidian's secret storage.
- Theme-aware — the default theme follows the Obsidian theme and light or dark mode.
Agate was built with heavy help from AI coding agents, with one demo vault that doubles as the test suite. Feedback and examples are welcome on GitHub.