Mapping my travels, again, but better
Why I keep drawing maps of my trips — and how my notes finally started drawing them for me.
I was 14 when the first member of my family went abroad. It was my Mom — she got onto a government-sponsored trip to Turkish Cyprus. It took another five years for me to finally go abroad myself. Perhaps this delayed, long-awaited experience made me strive for each trip to be The Journey.
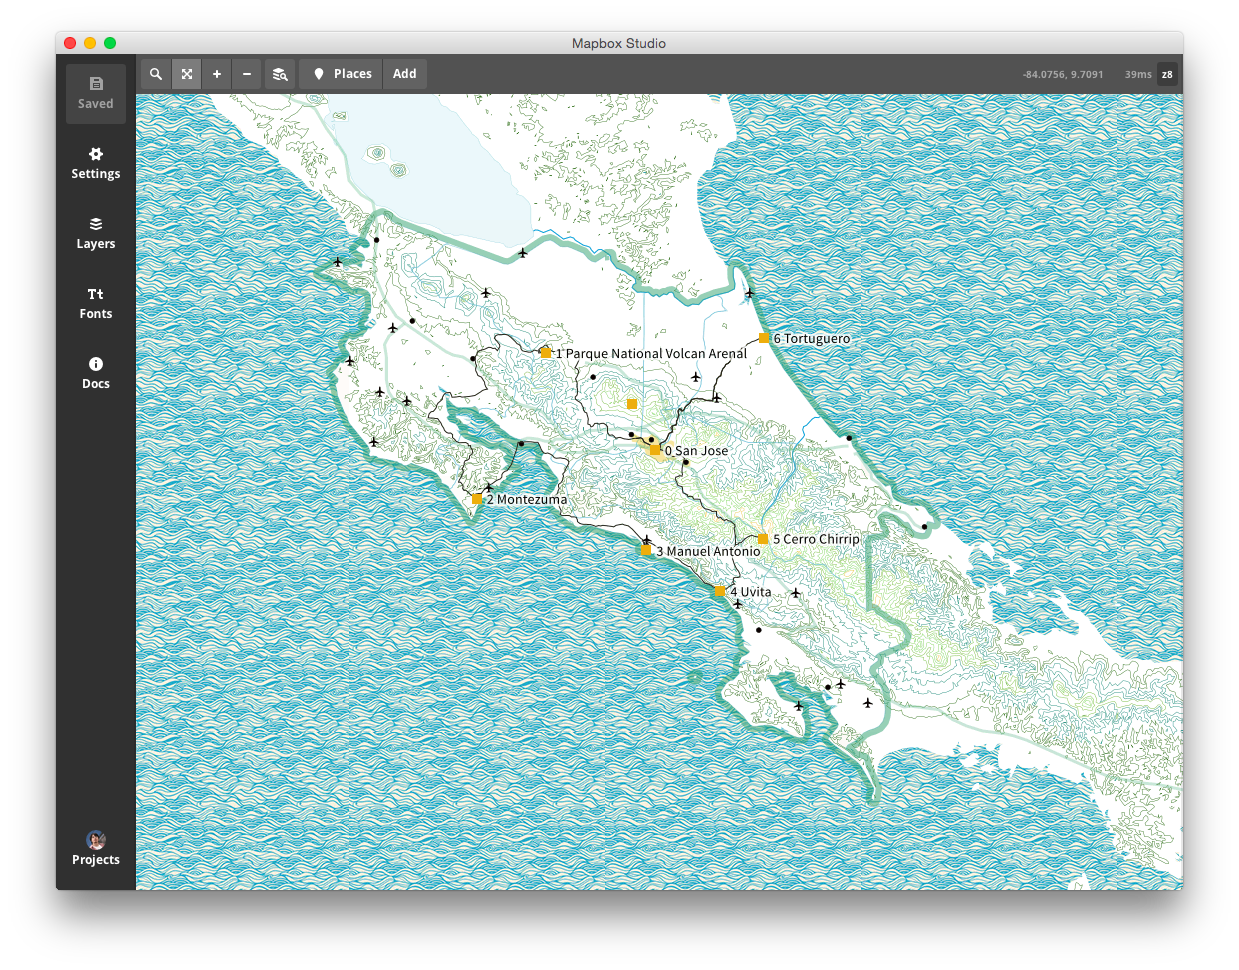 Costa Rica, 2014. Made in Mapbox Studio, the successor to TileMill. One of my early attempts — naive and imperfect; checking it now, I even found a few destinations placed incorrectly, and I'm not sure how that happened.
A month roving India, north to south. Two month-long trips roving Costa Rica, eleven years apart. Zigging and zagging through the Italian Alps. Those long travels do change your experience and sense of life, and provide an immense number of stories.
And planning trips, facing travel challenges and making decisions does feel empowering, somehow bringing me closer to the heroes of my childhood books: Cyrus Smith, Phileas Fogg, Richard Francis Burton. I guess that's why I've long been trying to record my travels and map them — not (only) as a visual testament, but also as an index, of sorts, linking all the stories, challenges, thoughts and emotions.
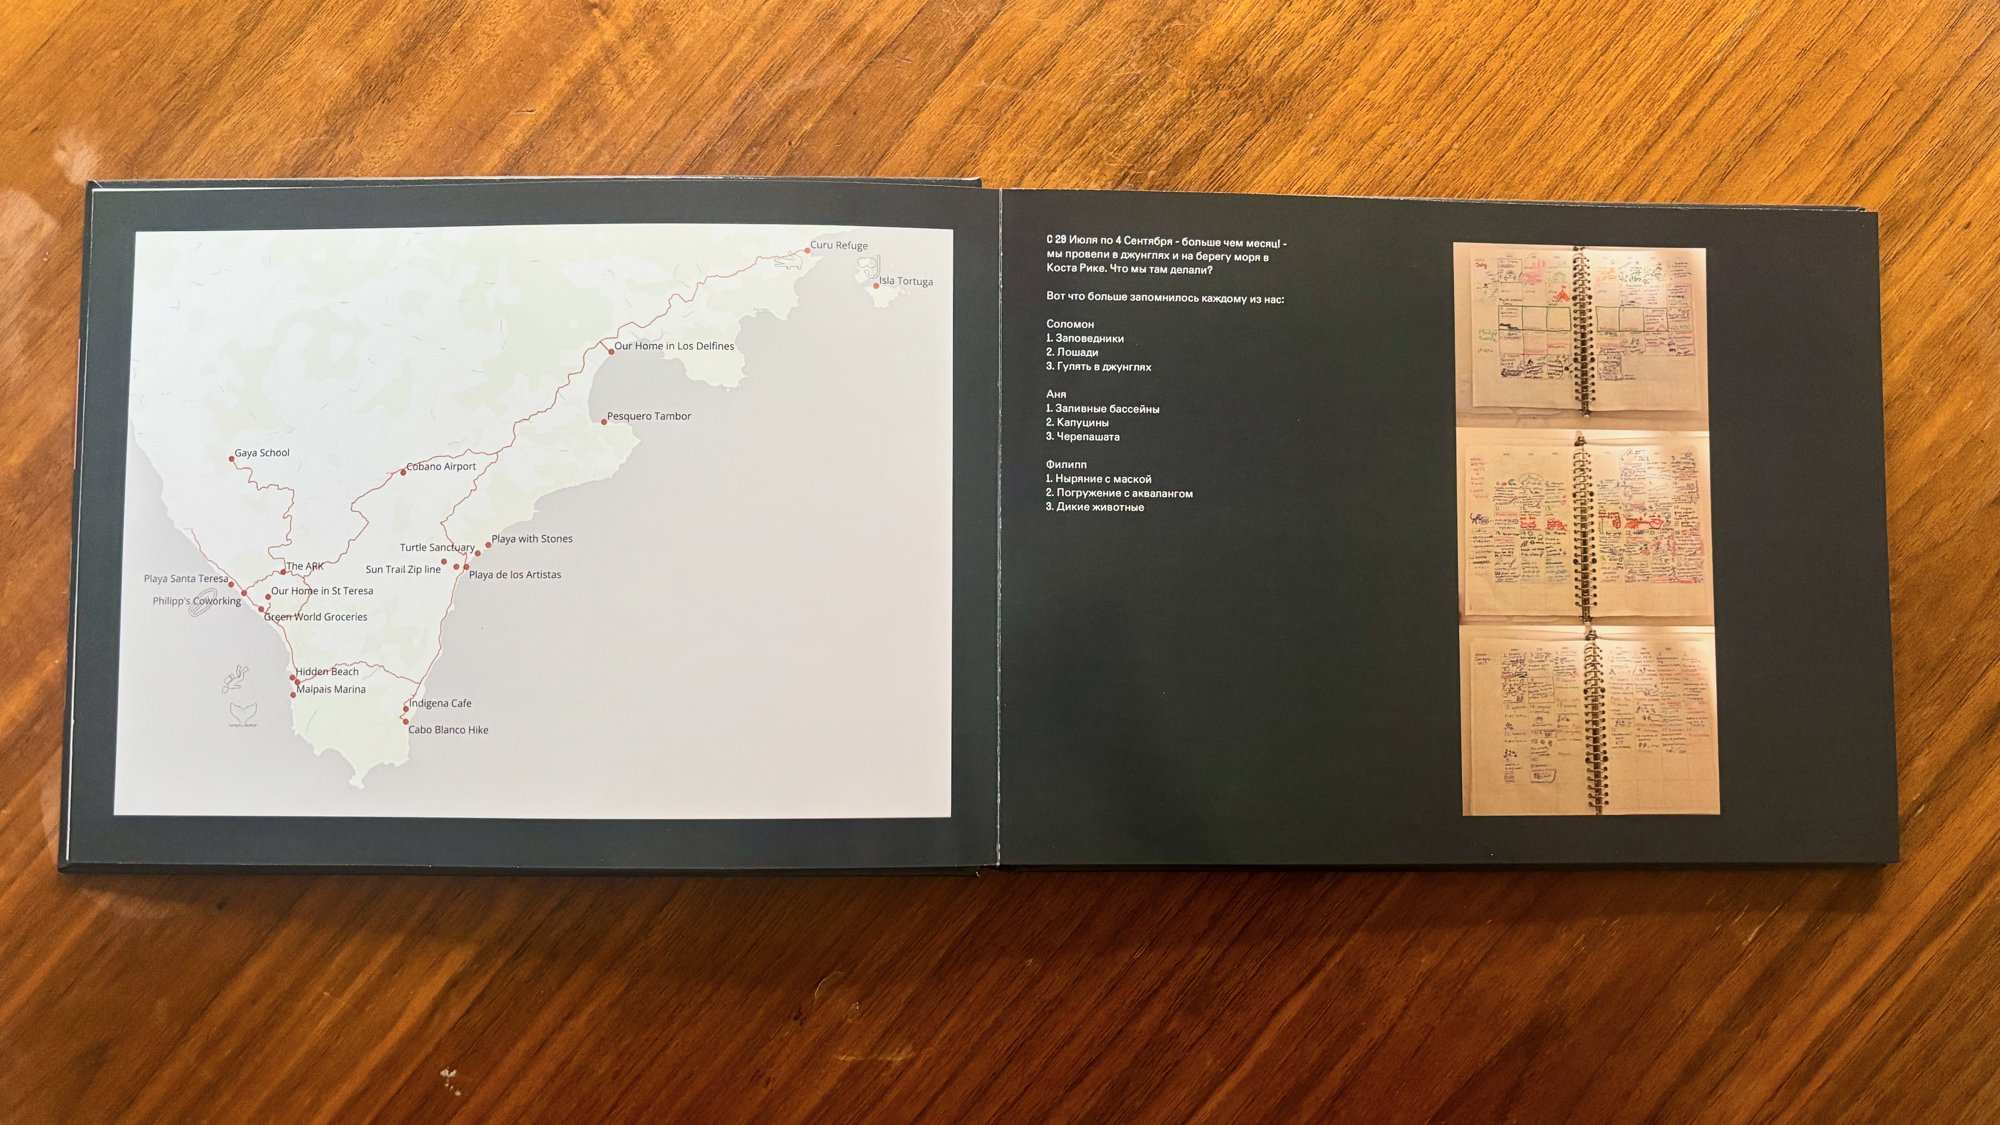 Costa Rica, 2025. A spread from our family photobook: the map, made in QGIS, next to everyone's top three memories of the trip.
Yet drawing those maps, while rewarding, took time, and I didn't have much of an audience to share them with. That changed when I became a father — from then on, maps became a part of the photobooks from our shared travels.
Of course, when I started using Obsidian to keep track of all my life in one place, travel plans and records were an obvious part of the migration. Details, arrangements, budgets, places to visit and travel logs — all were part of it from the start.
But the data visualisation part was lacking. With Agate, the plugin I built, that changed. With some tinkering, experimentation and inquiries to Claude, I was able to create a single map spec to rule them all that shows the itinerary of any trip I've had, on a map. Another spec, on top of the same data, shows the most important statistics.
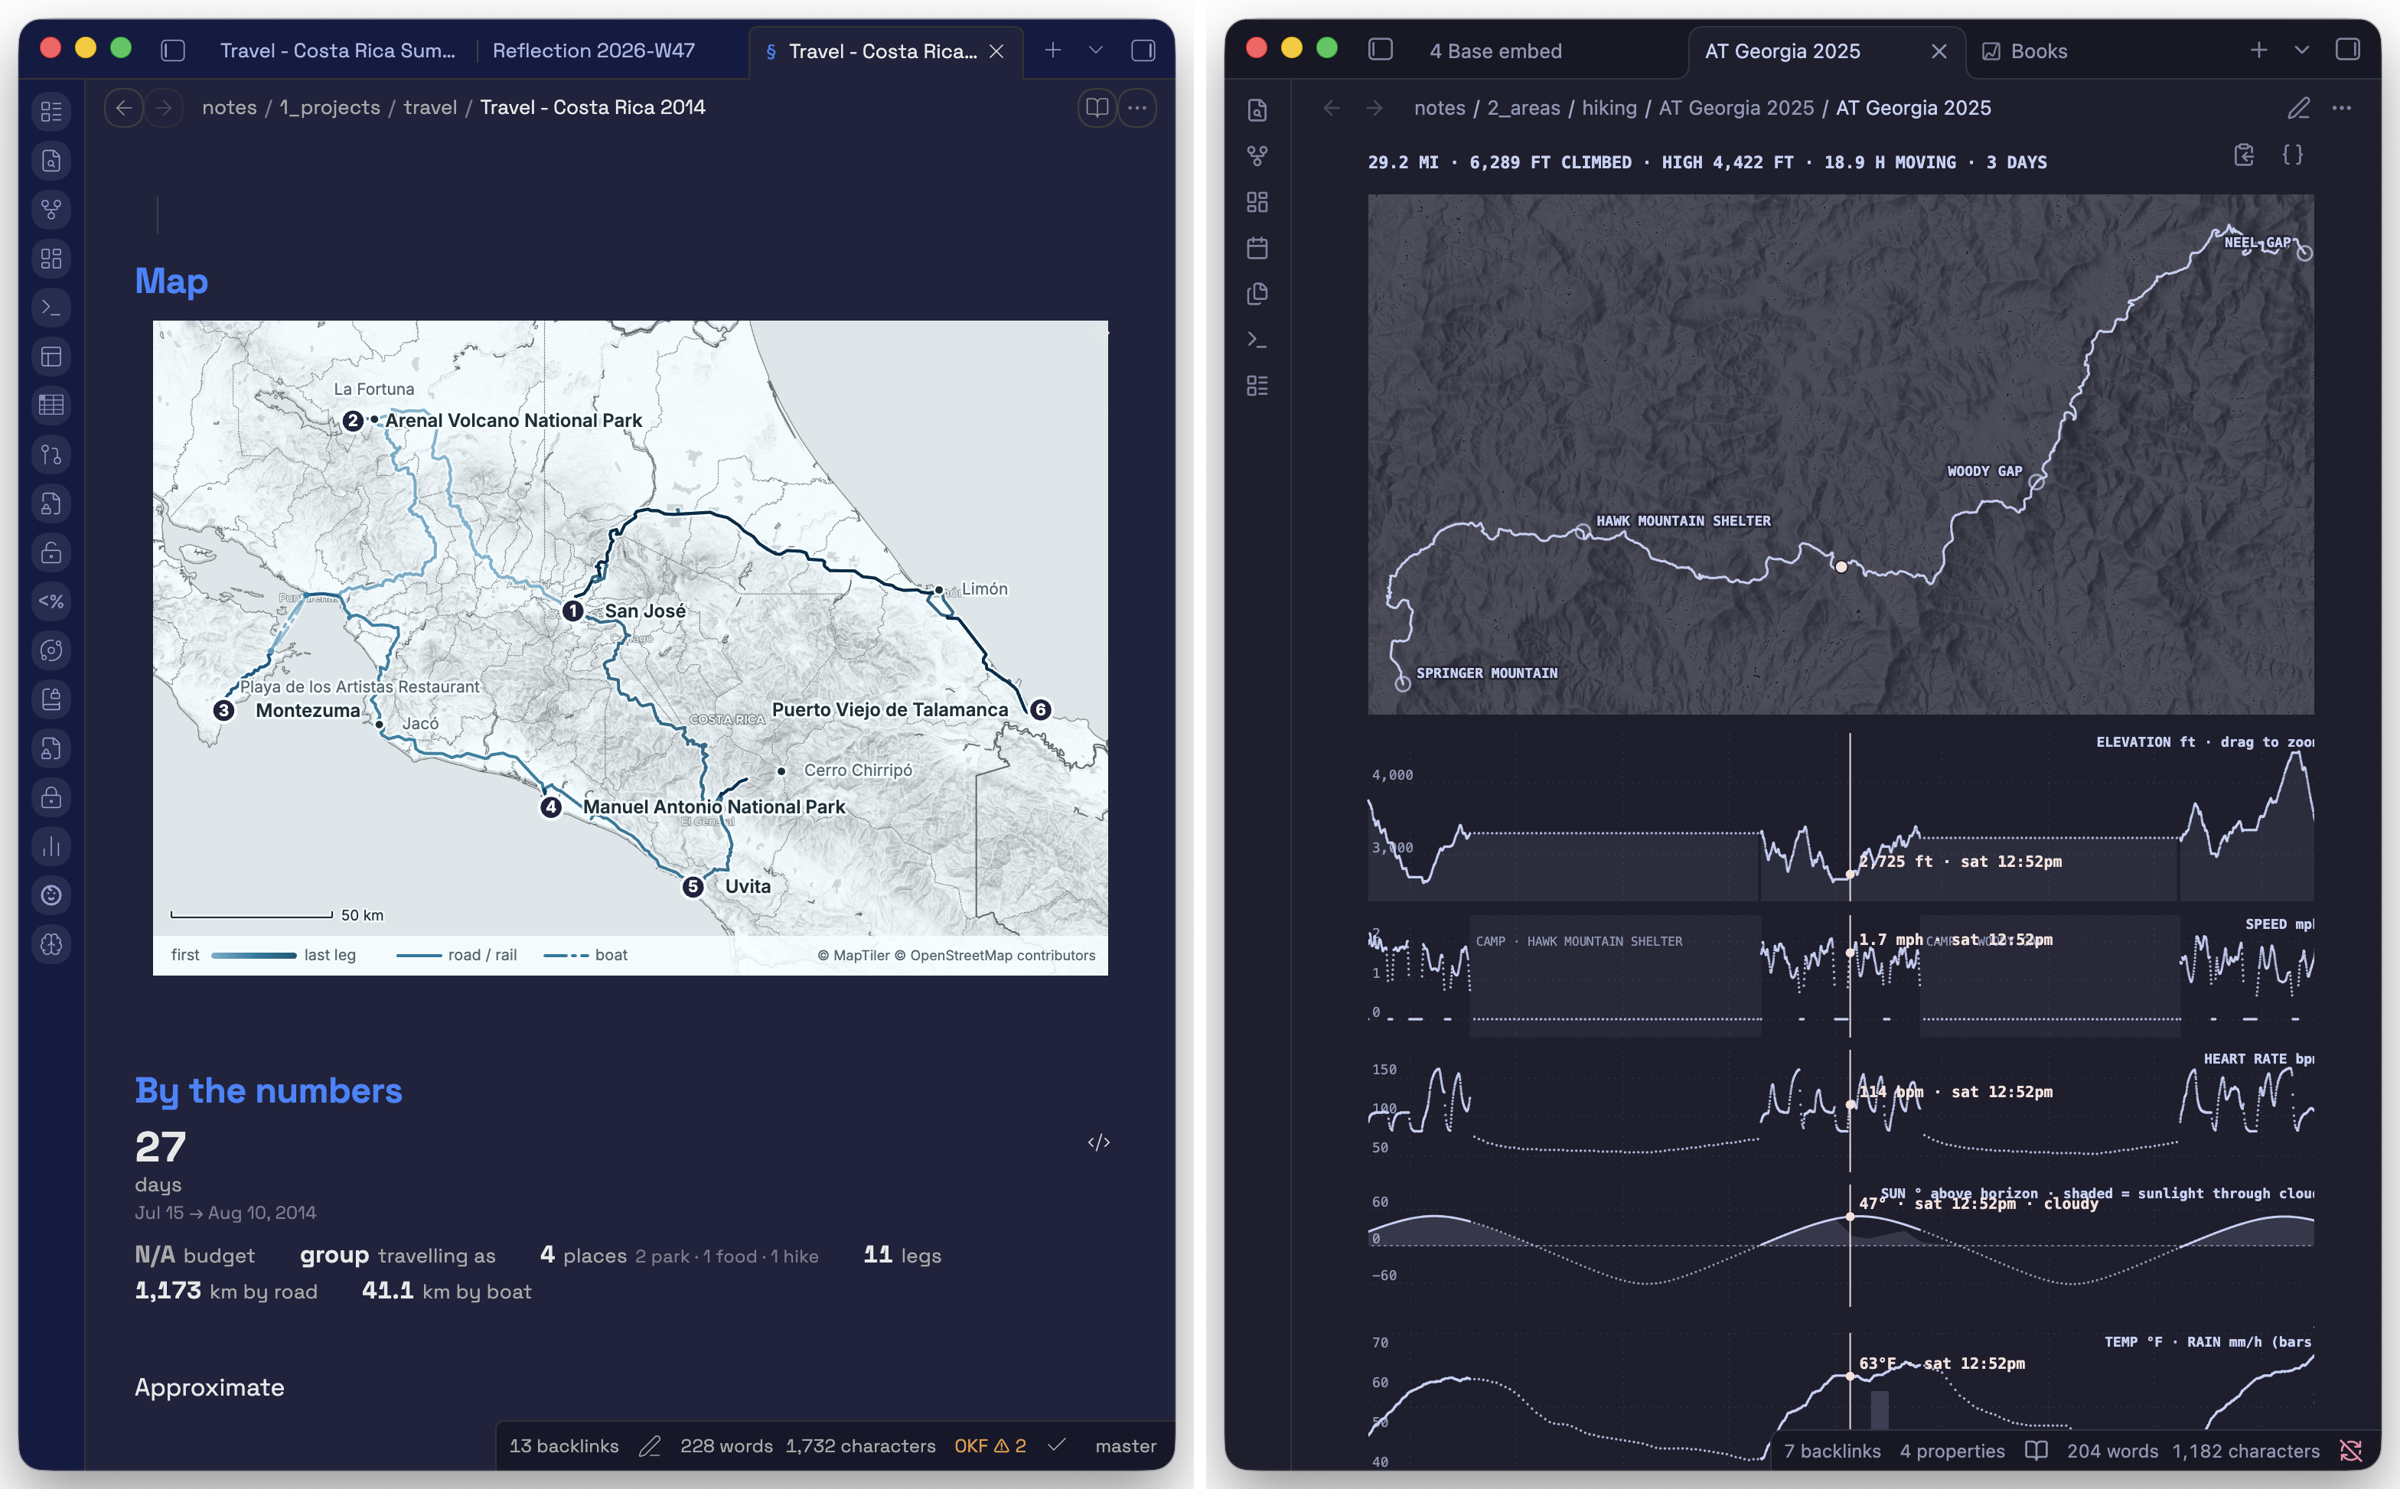
I am pretty happy with the result. Still, I am a bit concerned that the trips look almost cookie-cutter, and I am not fully satisfied with the free-tier MapTiler basemaps (labels get in the way). Perhaps another layer of information would help — iconography for experiences, top photos (that would require setting up private URLs and private image hosting within my network, a separate piece of work). All of it is yet to come.